How to Create a Report in dReveal
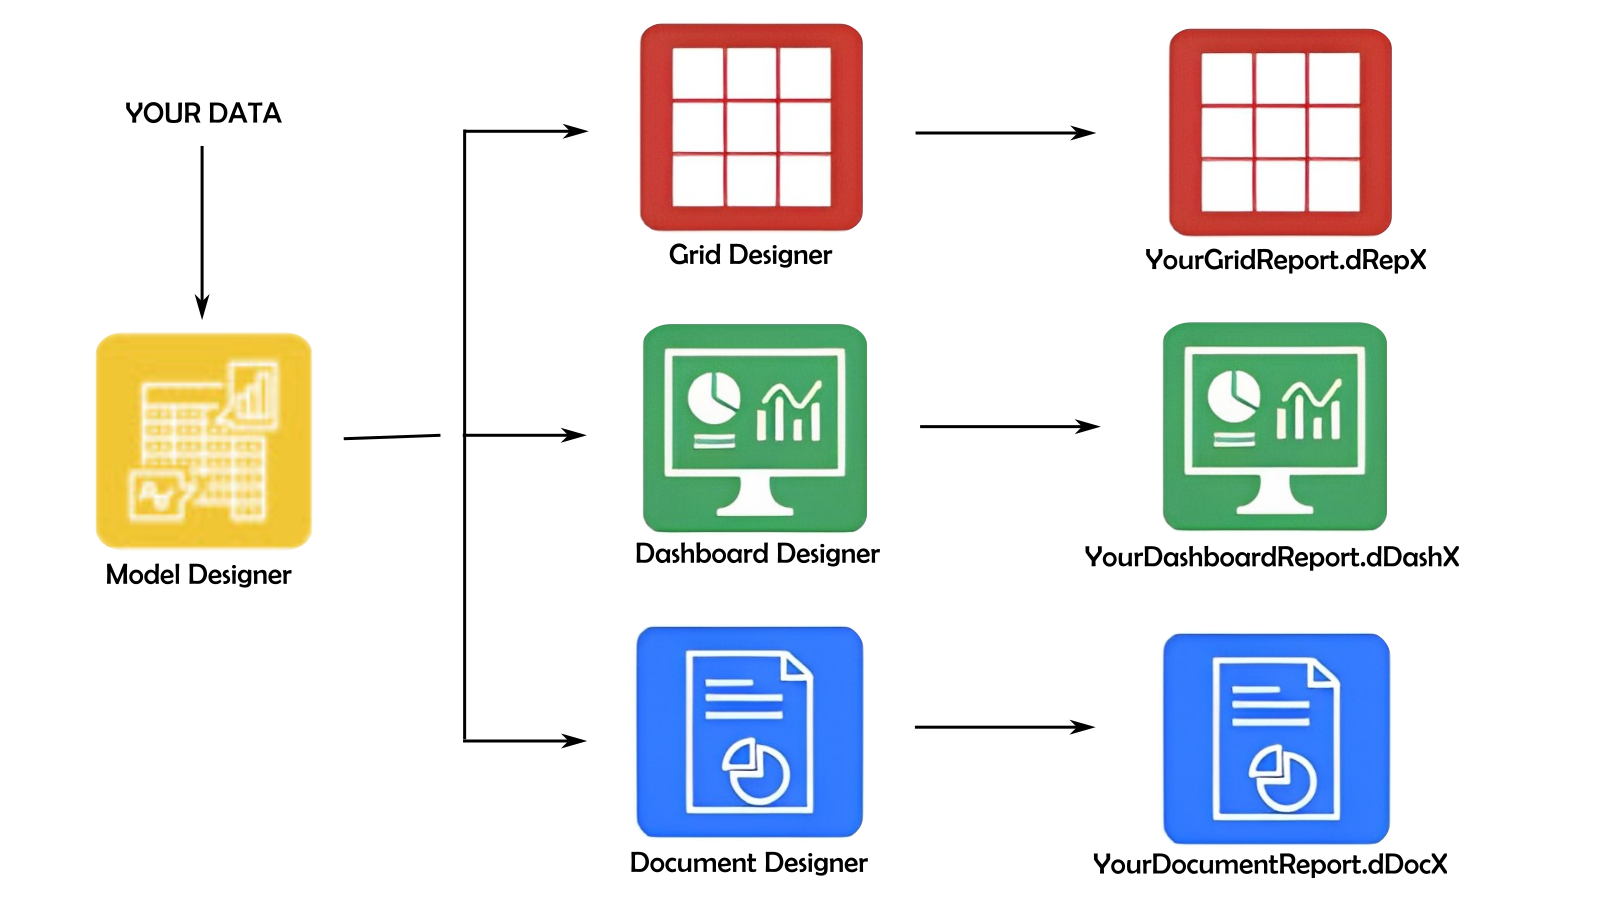
We will start with our model designer tool, which will connect to your database to establish the core structure of your reports. After connection, you can choose columns, connect tables, apply conditions, create calculated fields, and other features. This will generate a .dModelX file, which will be the critical foundation for moving forward with choosing the report type that best suits your needs.
This model becomes the basis for creating any of our three types of reports
- Grid Designer: You can create a report based on tables and columns. These kinds of reports allow you to format the data displayed according to your needs (select columns, order by, group by, conditional formatting, etc.).
- Dashboard Designer: You can create graphical, easy-to-understand reports. We offer a variety of charts to choose from according to your data needs.
- Document Designer: Create office documents which can be updated according to your data, we offers you the oportunity to display your data in a ready to print pdf format.
The image below illustrates how your data connects to our model designer. Following this process, the resulting .dModelX file serves as input for any of our report designers, which then produces the desired report type